
QEYSIGHTS
Applying Innovative technologies, methodologies and intelligence to deliver successful business performance improvement
Unique, Innovative and Unparalleled
Qeysights is an interactive Questionnaire and Dashboard (infographics and analysis) application that has been specifically designed to focus on providing clear insight and meaning through the combination of innovative technologies, methodologies and intelligence.
Qeysights uniquely provides immediate actionable outcomes tailored to business units, divisions, departments, functions and teams.
Risk reduction for M&A and investments
Key Features
- Interactive questionnaire
- Multi-dimensional dashboard application
- Immediately actionable outcomes
- Internal pockets of excellence
- Any function, area and topic applies
- space

Space
INTERACTIVE QUESTIONNAIRE
- Multi-lingual
- Easy fact-based non-emotive questions
- Objective answer descriptions with sliders
- Space
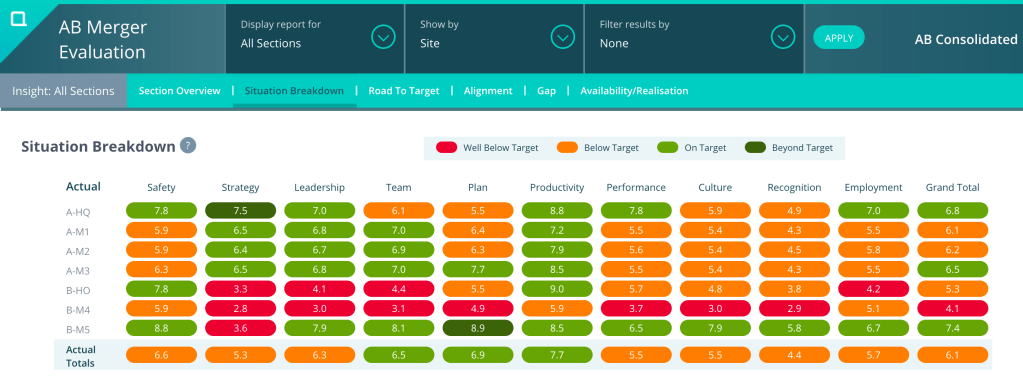
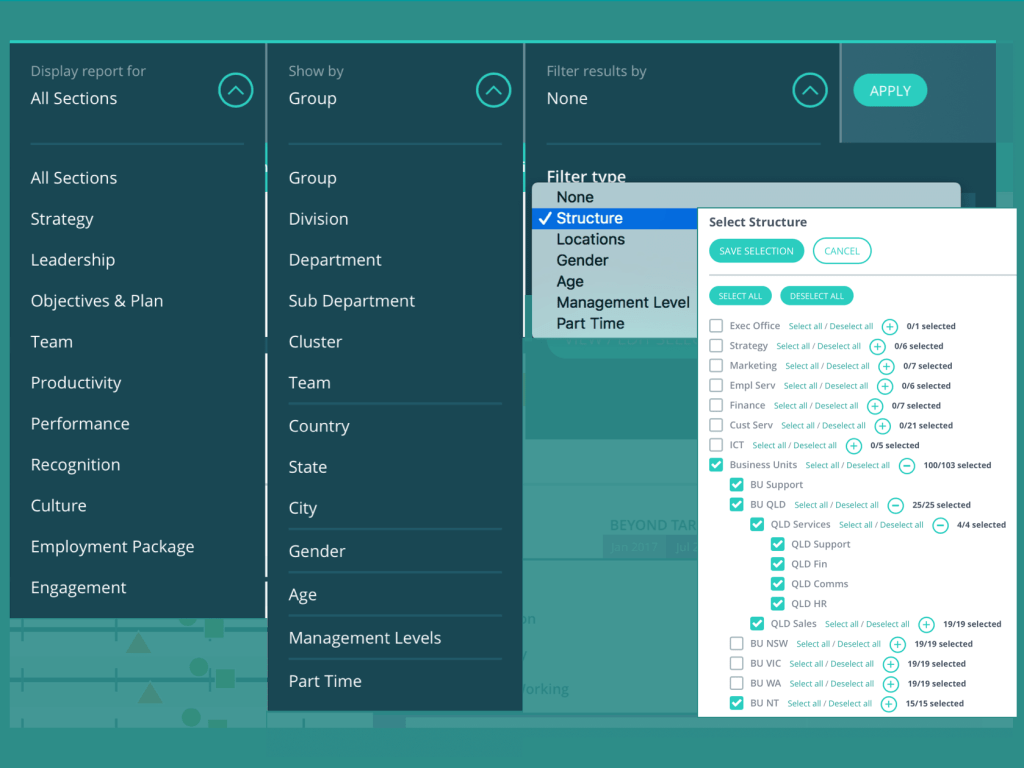
MULTI-DIMENSIONAL DASHBOARD
- For all levels of the business
- Slice and dice and compare by business unit, site, department, team, management levels, etc.)
- Space
Immediately Actionable Outcomes
- Insight into how to mature the organisation
- Future focused predictive measurements
- People’s current perception
- People’s expectations for the future
- Over- and under-performance
- Space
Internal Pockets of Excellence
Qeysights identifies internal expertise and high performing teams throughout the organisation. Teams that already deliver best practice can be recognised and their expertise applied to improve other areas of the business.
Space
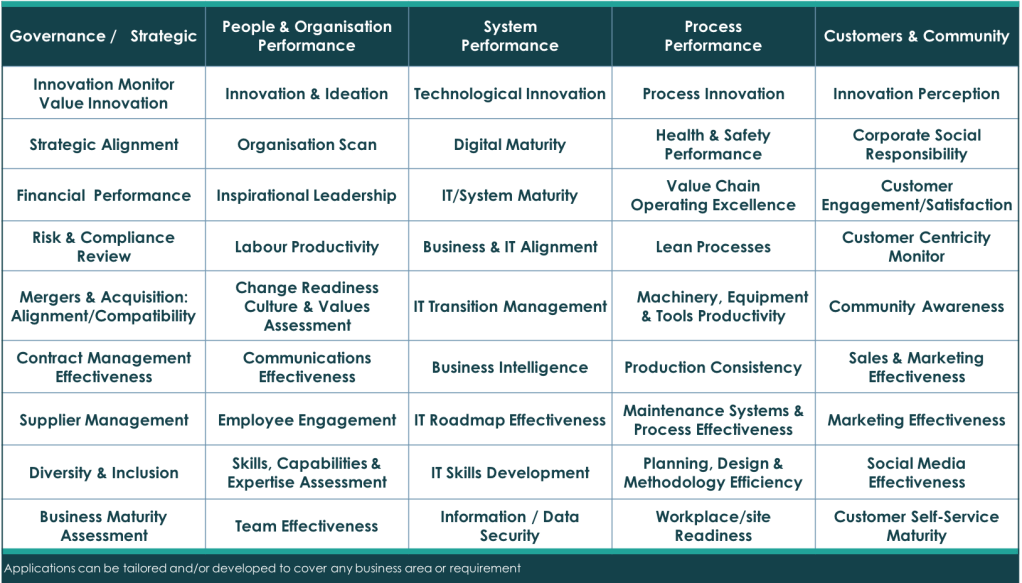
Any Function, Area or Topic Applies
A questionnaire may include (a combination of):
- Safety & Compliance
- Productivity & Efficiency
- Culture & Engagement
- Customer Centricity & Focus
- Bespoke, e.g.: Value, quality, output use, acceptance, efficiency, rework, etc.
T
Quote
“The results from IQEMY’s Qeysights Questionnaire were astonishing.
We were able to directly compare our leaders’ and teams’ results.
This generated conversations we had not had before, conversations we did not know we needed to have, and ones that directly influenced the focus and requirements of the transformation.”
Dr Carmen Letton, AngloAmerican plc
quote
Why QEYSIGHTS?
Traditional Surveys Are Outdated and Unreliable
Whilst digitalisation has moved the collection of survey responses into the 21st century, the possible answers are still based on the Likert Scale (invented in 1932) and have not advanced in their design since then.
More importantly, the outcomes lack meaning, provide no insight into the required actions to improve and are unreliable.
Millions around the world are wasted on these types of surveys, something Survey Providers do not want you to know about.
Why qeysights
why they fail
Controversy and Issues with Traditional Surveys
ACADEMIC CONTROVERSY
What survey providers do not want organisations to know, is that there is persuasive academic disagreement and controversy surrounding the usefulness of Likert Scale Models. In 1932 Rensis Likert developed an answer scale as a part of his Ph.D. thesis as a way to identify the extent of a person’s attitudes and feelings towards international affairs. Likert Scale Models are comprised of ordinal data, meaning that response options can be ranked, but the distance between responses cannot be presumed equal (Jamieson, 2004) despite the fact that researchers routinely presume they are. For example, the difference between being neutral and agreeing may be considerably different than the difference between agreeing and strongly agreeing, despite what the difference between the numerics 3-4 and 4-5 might imply.
Mean and standard deviation statistical analysis is not applicable to ordinal data, implying a 1.5 mean derived from averaging Likert Scale data has no meaning. Using this statistical technique, the researcher increases the chance of coming to the wrong conclusion about the significance (or otherwise) of his research (Jamieson, 2004).
Yet, even if one accepts that it is valid to assume interval status for Likert-derived data, data sets generated with Likert-type scales often have a skewed or polarised distribution. Major issues which can affect statistical inference are those of bias, and lack of independence of the data, which are often ignored because they are difficult to quantify. An example is differences in perception between age groups, sexes, nationalities, etc.
Furthermore, the answers to emotive (positive and negatively charged) questions generally used with the Likert Scale are also skewed by moods and how people want to be perceived, e.g. someone having a disagreement with their manager at the time of the survey will answer differently to the same person a day earlier when the argument didn’t exist.
MISLEADING VALUE
Traditional surveys currently used by organisations try to provide information for which they were not developed. They use positively and negatively charged questions, the answers to which are skewed by moods and how people want to be perceived. The answer scales are based on past focussed ordinal data (i.e. data with an inconsistent distribution or interval) to which statistical analysis is applied. Significant effort and money are spent on these surveys, deciphering the analysis (all Lagging Indicators*), and developing projects to action them. While there is persuasive academic disagreement about the usefulness of this analysis and the subsequent outcomes, organisations are forced to use these traditional surveys as there has been no real alternative until now.
The value these surveys currently provide, is trend data which can show the organisation’s past progress. These Lagging Indicators* are used to make assumptions about the future and to estimate the value of implemented actions. How to actually move between selections is not evident. The reason for a rating is not identified and hence how to increase ratings is not discernible from the data.
As organisations are so used to having this type of (trend) data, it is accepted that the outcomes are actually not optimal for developing and implementing improvements. Organisations are therefore required to spend significant amounts of effort and money on deciphering the outcomes and developing projects to action them.
While these traditional surveys served a purpose in the past (this was the only survey approach), they are now outdated due to the availability of new and smarter technologies, approaches and methodologies.
ANSWER SCALE ISSUES
Most organisations base their surveys on the 5- to 10-point Likert Scale Model (Strongly Agree to Strongly Disagree) using positively and negatively worded questions like the examples shown above.
These types of surveys have several issues:
The outcomes (average scores of respondents) have little meaning and do not provide clear insight into the actions that need to be taken to improve, e.g. If a company’s average score is a 6.2 what do they need to do to get a 7.2, and why is a 7.2 the target? Or, what do they need to do to move a certain percentage of the organisation from “Neutral” to “Agree”.
The question style is not exact: asking people what they “would” do, doesn’t mean they actually will.
The answer scale lacks an exact meaning, e.g.: What does a 5 or an 8 really mean? Cultural backgrounds influence the scores. For the Dutch a 6 is good, for the American this is an 8. Moods also influence this type of scoring.
